Complete Statistics On Gambling Industry in the UK
- Based on the Gambling Commission Data Collected Since 2009
- Gambling Statistics Report: 2015-2020
- Gambling Statistics Report: 2015-2019
- Gambling Statistics Report: 2014-2017
- Gambling Statistics Report: 2013-2016
- Gambling Statistics Report: 2010-2015
- Gambling Statistics Report: 2010-2014
- Gambling Statistics Report: 2009-2014
Based on the Gambling Commission Data Collected Since 2009
Gambling in the UK has been an ever-changing sector, affected by a variety of factors such as new types of gambling machines, changes in the operators’ distribution of premises, world cups and tournaments, and during the last year the COVID-19 pandemic.
Before moving forward with the Gambling Commission statistics, it’s important to note that data figures up to March 2012 were given by local authorities and were oftentimes incomplete. From March 2013 to March 2015, figures were provided by operators in regulatory returns. Finally, from April 2015, figures are collected directly from regulatory returns. Thus, we recommend not to compare the data across the different data sources.
Gambling Statistics Report: 2015-2020
Gambling Industry Data
Gambling returns are required to be done either quarterly, in the case of remote, non-remote, and large betting license holders, and annually for everybody else. Even so, gambling operators chose their reporting periods, for a variety of reasons listed in the introduction, and therefore some numbers may be estimates. These estimates are adjusted for by using an apportioning system that values the reports by different weights based on how close they are to the gambling commissions reporting periods.
It’s also important to keep in mind for this report that march 2020 coincided with the beginning of COVID-19 and the associated measures to keep it in check. Therefore, figures may be skewed due to that.
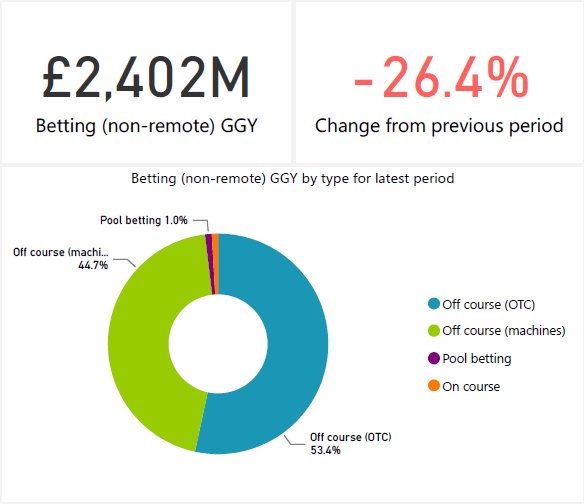
Betting
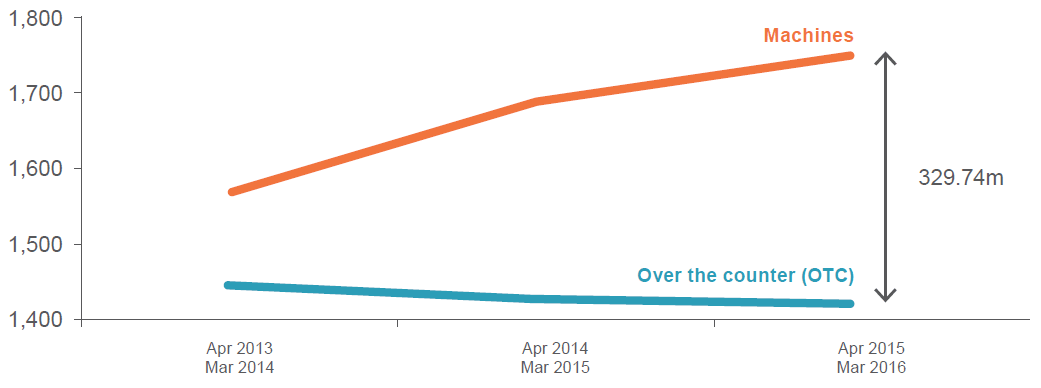
As of March 2020, betting GGY was £2.4bn, a large decrease of £859.5m (-26.4%) from £3.3bn. This decrease was mostly divided between pool betting (£31.3m, -57.0%) and machines (£751.6m, -41.2%), with a smaller decrease of over-the-counter (£69.8m, -5.2%).
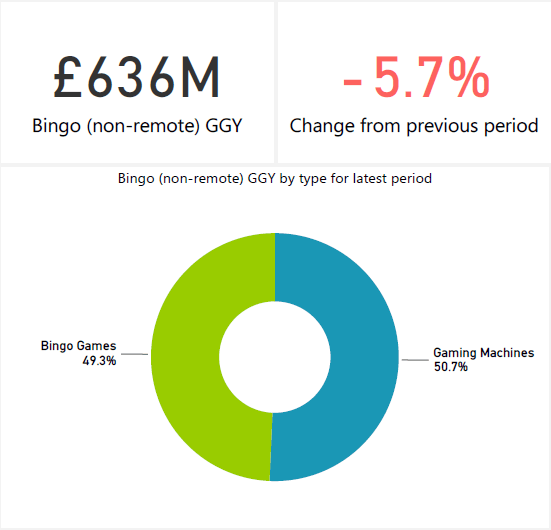
Bingo
Bingo saw a smaller GGY decrease of £38.4m (-5.7%) from £674.4m to £635.9m as of March 2020. This decrease was mostly driven by Bingo Games (£36.2m, -10.4%) and Machines by (£2.2m, -0.7%).
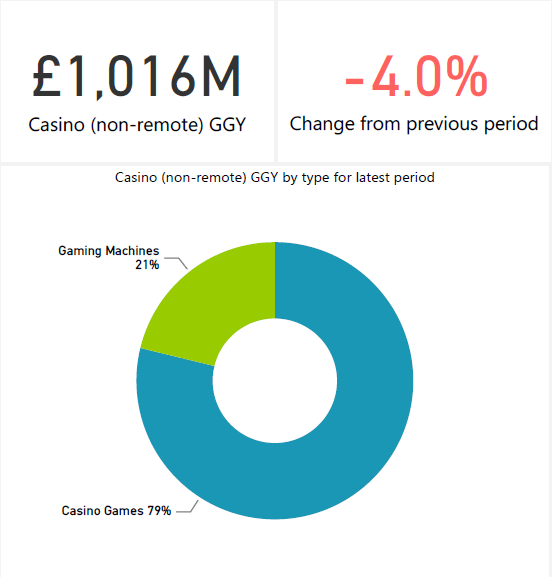
Casino
Casino also saw a similar decrease of £42.8m (-4.0%) from £1.1bn to £1.0bn during April 2018 – March 2019 and April 2019 – March 2020. The decrease was due to casino games which decreased by £38.8m (-4.6%) and Machines, which decreased by £3.9m (-1.8%).
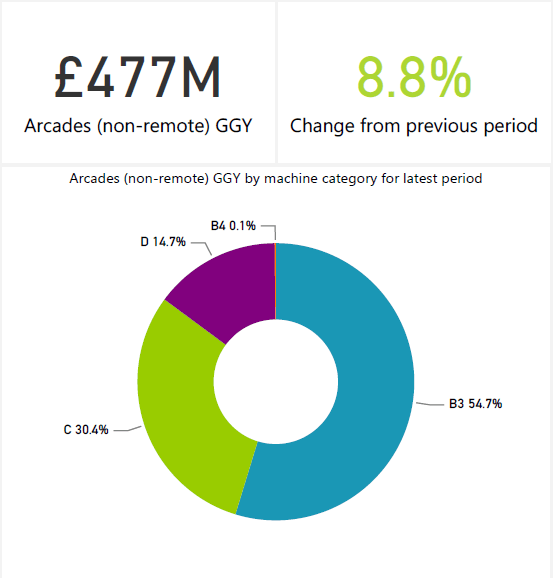
Arcades
Conversely, arcades saw a substantial increase of £38.7m (8.8%) from £438.5m to £477.3m during the period of April 2018 – March 2019 and April 2019 – March 2020. The increase was primarily driven by B3 (£30.1m, 13.0%) and C (£8.6m, 6.3%) category machines, with a smaller decrease in the D category of £0.2m (0.3%).
That being said, the increase was very slightly offset by a GGY decrease for B4 machines of £0.1m (-17.8%).
Remote Gambling
Remote gambling was the largest combined sector by GGY, accounting for 39.9% of the overall market and seeing an increase of 8.1% to £5.7bn.
Gambling Statistics Report: 2015-2019
Gambling Industry Data
Regulatory returns are done bi-annually. Even so, some figures may be estimated because operators chose a particular day of the year to send in their return to the gambling commission. This can vary widely for a variety of reasons, such as lining up their returns with their financial period.
Also important to keep in mind for this report specifically, is that new regulations for category B2 machines decreased the maximum stakes from £100 to £2 in April 2019. As such, only the first 6 months since that regulatory change are included in the report.
Betting
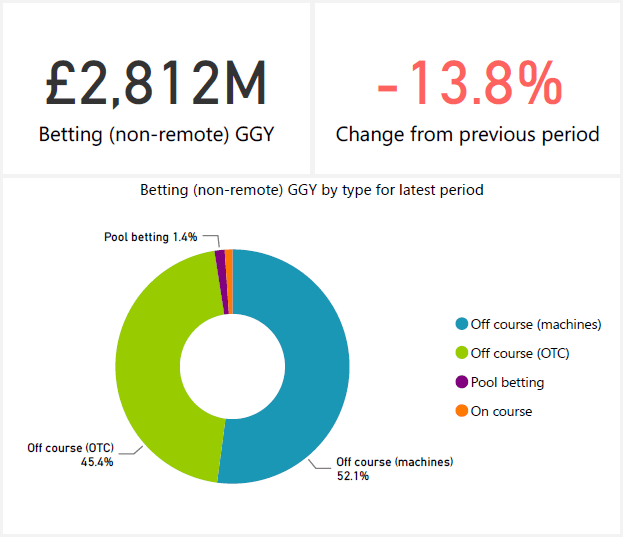
As of September 2019, betting GGY amounted to £2,811.7m, a £449.7m (-13.8%) decrease from £3,261.4m, which was due to a decrease in off-course gaming machines by (£361.2m, -19.8%), over the counter (£74.7m, -5.5%), and pool betting (£15.0m, -27.5%).
Bingo
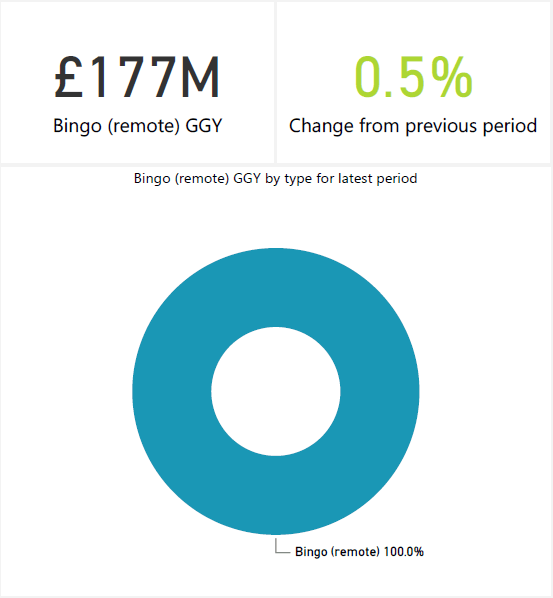
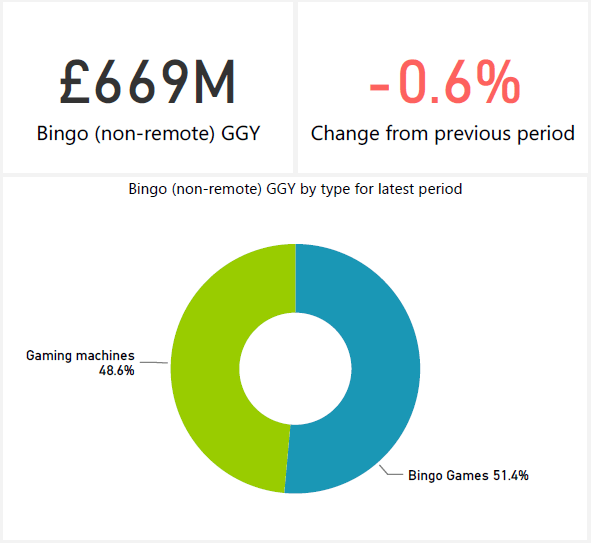
Bingo also saw a small decrease of £4.4m (-0.6%) from £673.3m to £669.0m, with the decrease mostly due to a decline of bingo games (£5.3m, -1.5%), which was slightly offset by an increase of gaming machines (£1.0m, 0.3%).
Casino
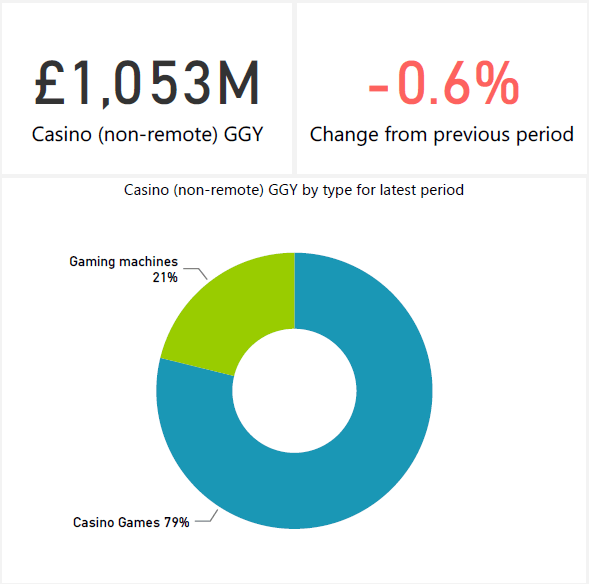
As of September 2019, Casino GGY saw a decrease of £6.1m (-0.6%) from £1,058.8m to £1,052.7m. This decline was due to a decline in casino games of £9.5m, (-1.1%), but which was offset by an increase in gaming machines by £3.4m (1.6%).
Arcades
As of September 2019, arcades GGY saw an increase of £25.8m (5.9%) from £435.9m to £461.7m. Increases were divided between B3 (£16.9m, 7.4%), C (£5.0m, 3.7%), and D (£4.0m, 5.7%) machines. Conversely, there was a decrease in B4 machines GGY of £0.1m (-8.1%).
Remote Gambling
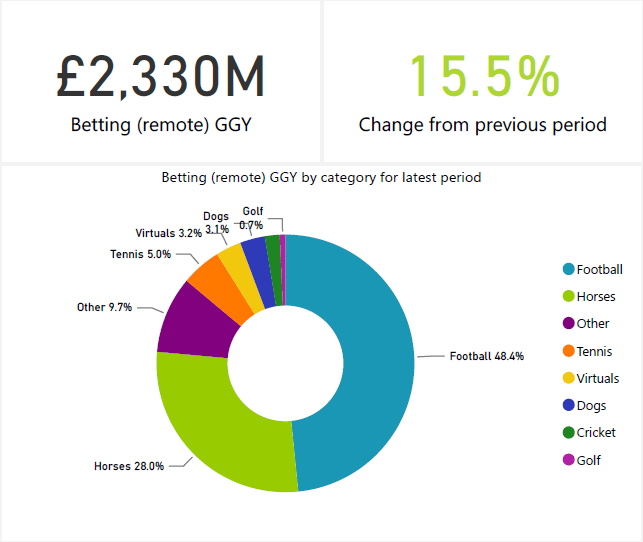
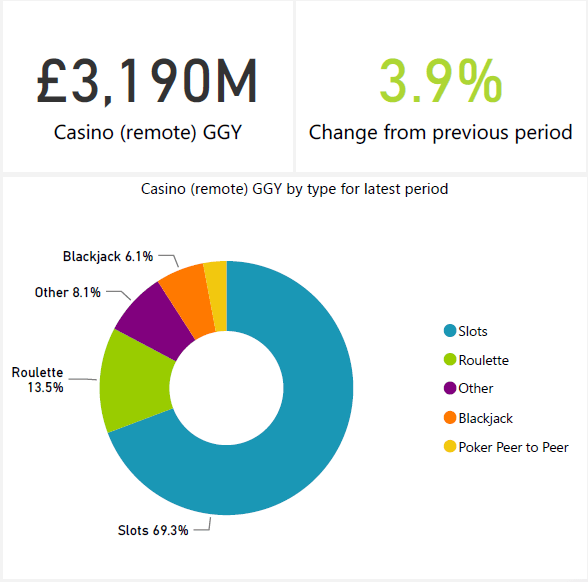
Remote gambling was again by far the largest combined sector in the industry, accounting for £5.5bn GGY (38.6%) of the overall £14.3bn market, which saw an increase of £229.3m (4.3%).
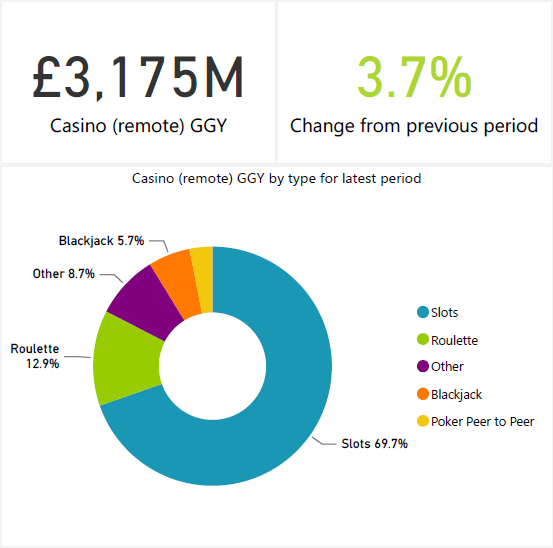
More specifically, online casino is the largest sector in remote gambling with £3.2bn in GGY, mostly from slot games.
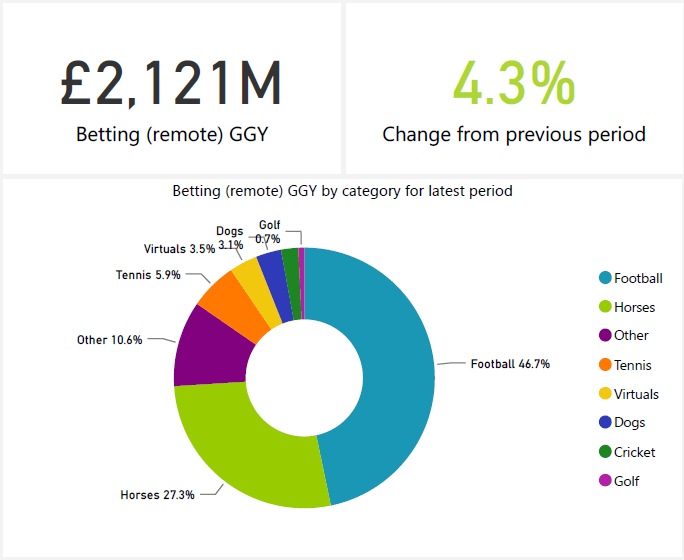
Remote betting GGY on the other hand was £2.1bn and was led by both football and horses.
Gambling Statistics Report: 2014-2017
Gambling Industry Data
Due to the gambling commission introducing new rules regulating any operator dealing in GB or with GB citizens, any data before November 2014 could no longer be used to compare to data post-November 2014. To that end, remote data for point-of-consumption covers only April 2014 to March 2015.
It is also important to note that since operators chose their reporting periods, some data may be estimated and adjusted for by the gambling commission.
Betting
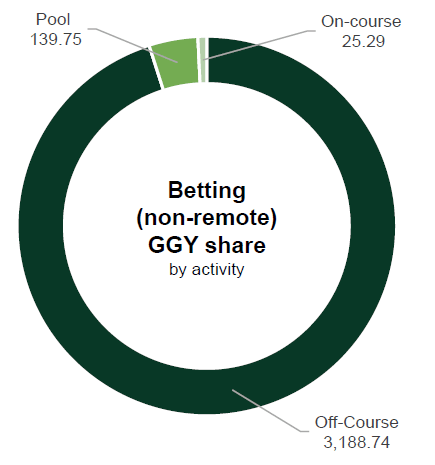
As of 31 March 2017, off-course betting dominated the total figures for non-remote betting at 95% share, with pool (4%) and on-course (1%) betting taking a tinier portion. There were 235 operators by the end of the report, which was a decrease of roughly 10% from the previous year of 31 March 2016.
The total GGY for non-remote betting was £3.35bn from April 2016 to March 2017, constituting 24% of the industry as a whole.
In terms of off-course betting, there were 8,502 premises as of 30 September 2017, a decrease of 3.9%.
Overall, the off-betting sector is dominated by four operators who account for 87.2% of the market: WilliamHill, Ladbrokes, Betfred, and GalaCoral.
| Organisation | As at 31 Mar 2016 | As at 31 Mar 2017 | As at 30 Sep 2017 | % of total betting shops |
| William Hill | 2,326 | 2,379 | 2,372 | 27.9% |
| Ladbrokes | 2,149 | 1,945 | 1,736 | 20.4% |
| Betfred | 1,366 | 1,637 | 1,671 | 19.7% |
| Gala Coral | 1,835 | 1,680 | 1,634 | 19.2% |
| Other operators | 1,238 | 1,203 | 1,089 | 12.8% |
| Total | 8,914 | 8,844 | 8,502 | 100% |
Number of betting shops by operator
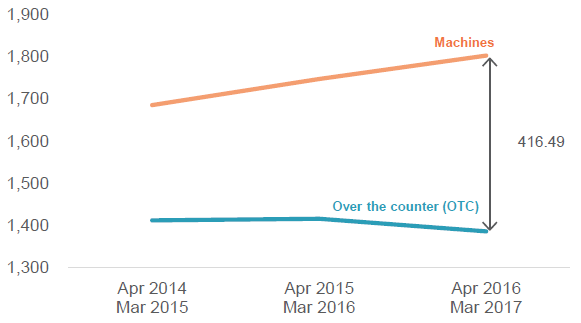
GGY for off-course betting was nearly evenly split between over-the-counter betting at £1.39bn (43.5%) and machines in betting premises, at £1.8bn (56.5%).
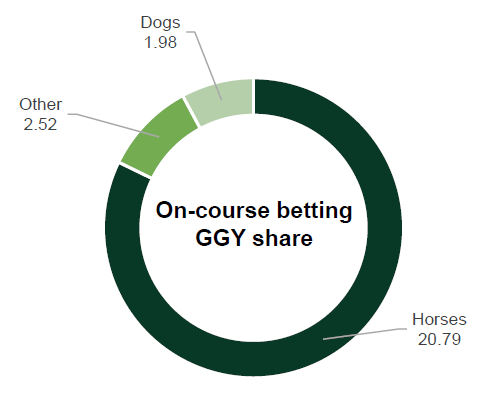
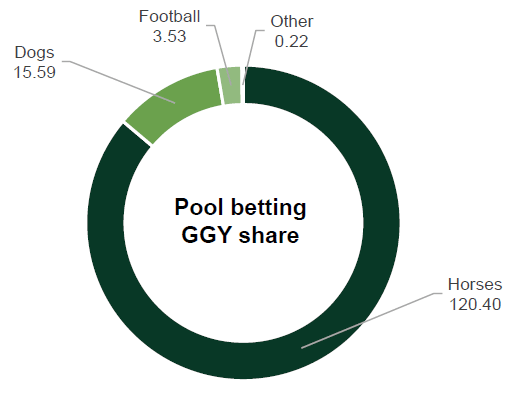
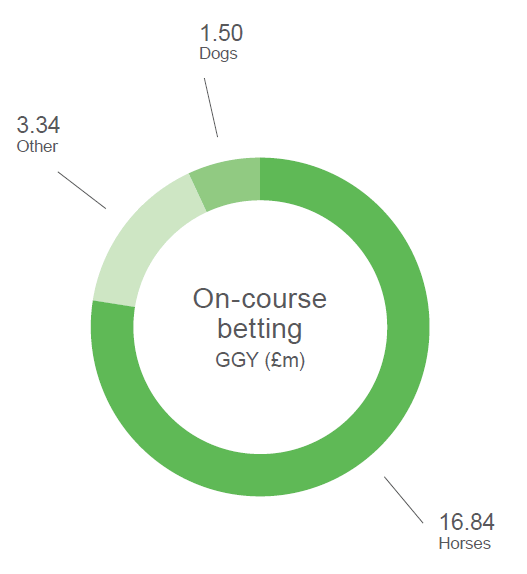
On-course betting GGY was £25.29m this year, a decrease of 5.8%, and was dominated by horses who accounted for £20.79m, a decrease of 3.8%. ‘Other’ also declined by roughly 24.4%.
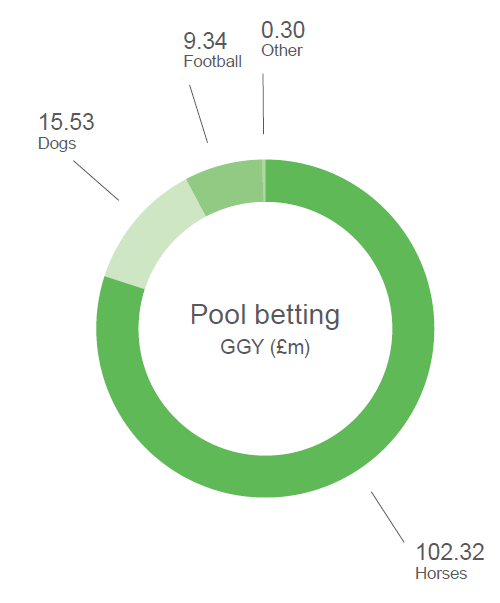
Finally, pool betting GGY was £139.75m, which was a 10.2% increase from the previous period. Horses also dominated pool betting, accounting for £120.40m of the total, followed by dogs, football, and other.
Bingo
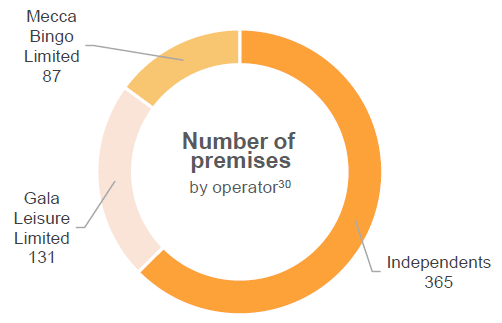
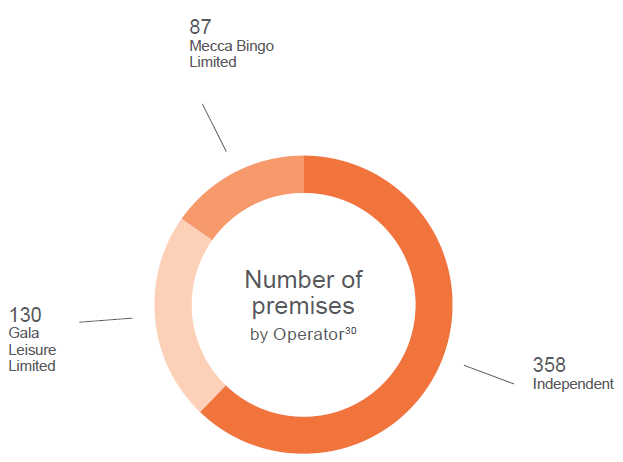
As of 31 March 2017 there were 191 Bingo operators, with 583 premises as of 30 September 2017. The sector had two dominant companies in the reporting period: Gala Leisure Limited and Mecca Bingo Limited.
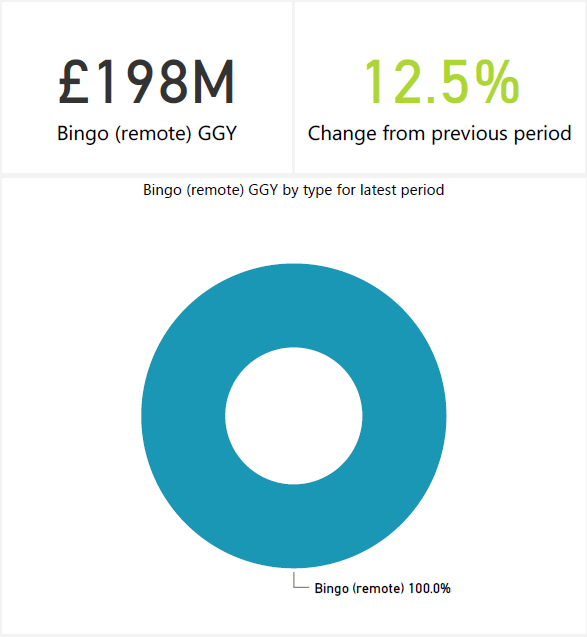
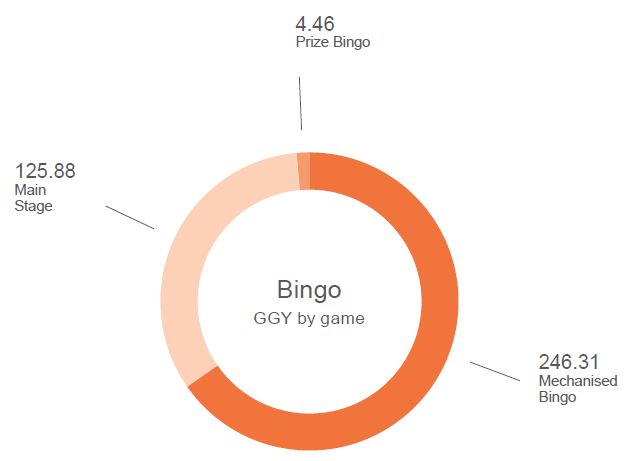
GGY for remote bingo £368.82m from April 2016to March 2017, which was a 2.1% decrease. The sector was dominated by mechanized bingo at 64.4%, followed by mainstage bingo (34.3%) and prize bingo (1.3%).
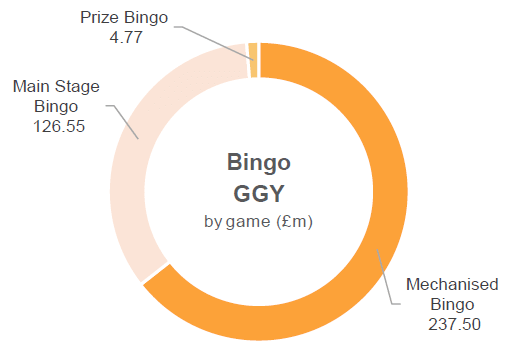
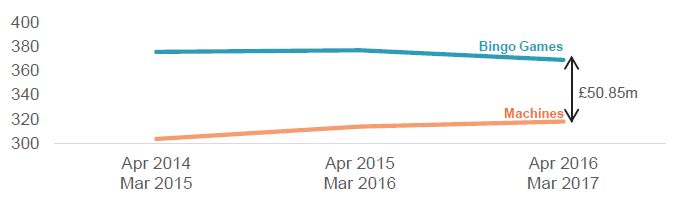
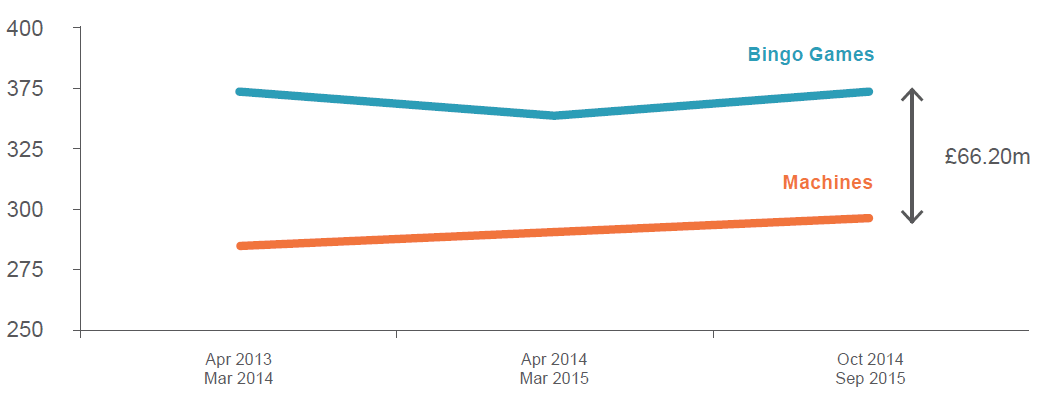
Bingo GGY for both bingo games and machines was split nearly evenly between bingo games at £368.82m (53.7%) and machines at £317.97m (46.3%).
Casino
There were 146 casinos operating as of 30 September 2017, with the sector being mostly dominated by two companies that accounted for 71%: Rank Group and Genting UK.
| Organization | As at 31 Mar 2015 | As at 31 Mar 2016 | As at 30 Sept 2017 |
| Rank Group | 63 | 61 | 63 |
| Genting UK | 41 | 42 | 41 |
| Caesars Entertainment | 9 | 9 | 9 |
| 2005 Act Casinos | 4 | 6 | 6 |
| Other operators | 31 | 27 | 27 |
| Total | 148 | 145 | 146 |
Number of operating casinos (2005 and 1968 Act casinos)
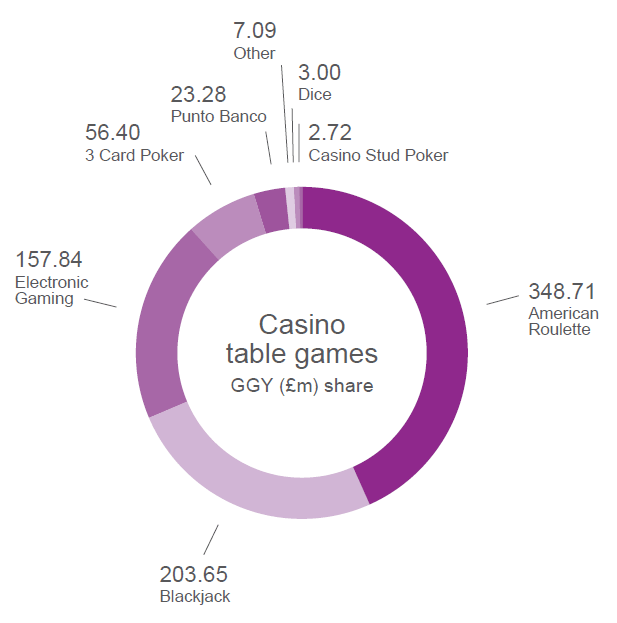
In terms of Casino GGY, American roulette contributed the largest share of 37.1%, followed by Punto Banco at 19.5%, and Blackjack at 18.9%.
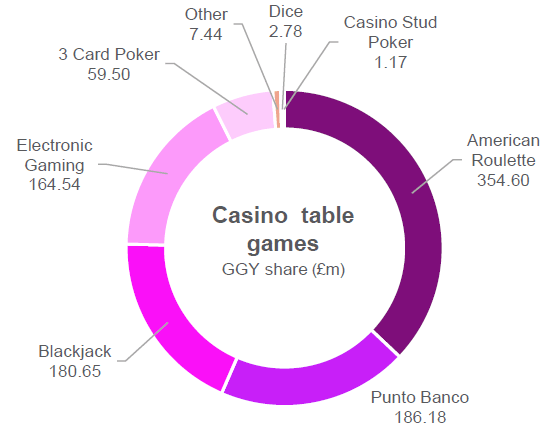
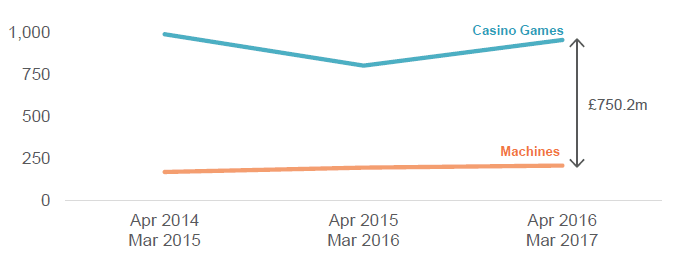
Casino and gaming machine combined GGY was £1,163.54m, with casino games accounting for £956.87m (82.2%) of the total, and gaming machines accounting for £206.67m (17.8%).
Arcades
Arcade sector GGY was £414.4m during April 2016 to March 2017, which was a 0.2% decrease from the previous period. As of 31 March 2017, there were a total of 468 AGC licenses and 155 FEC licenses held by 507 operators.
| Commission Licensed activity | As at 31 Mar 2015 | As at 31 Mar 2016 | As at 30 Sept 2017 |
| Adult gaming centre (AGC) | 1,548 | 1,550 | 1,476 |
| Family entertainment centre (FEC)35 | 322 | 295 | 274 |
| Total | 1,870 | 1,845 | 1,750 |
Number of arcade premises
There was an average of 58,307 AGC machines during this period, and AGC machine GGY was £349.88m, a 1.6% increase.
| Machine category | Apr 2014-Mar 2015 | Apr 2015-Mar 2016 | Apr 2016-Mar 2017 |
| B3 | 9,774 | 10,656 | 11,805 |
| B4 | 135 | 118 | 81 |
| C | 27,686 | 29,576 | 32,296 |
| D | 14,663 | 14,773 | 14,125 |
| Total | 52,257 | 55,124 | 58,307 |
AGC machine numbers (average)
| Machine category | Apr 2014-Mar 2015 | Apr 2015-Mar 2016 | Apr 2016-Mar 2017 |
| B3 | 155.76 | 175.13 | 193.06 |
| B4 | 0.34 | 0.38 | 0.29 |
| C | 109.63 | 119.72 | 126.48 |
| D | 25.37 | 25.20 | 24.61 |
| Aggregated categories36 | 26.30 | 23.89 | 5.44 |
| Total | 317.40 | 344.33 | 349.88 |
AGC machine GGY (£m)
As for FEC, the average machine quantity was 21,727 this period, which was a 10.5% decrease. FEC GGY was £64.52m, a decrease of 8.8%.
| Machine category | Apr 2014-Mar 2015 | Apr 2015-Mar 2016 | Apr 2016-Mar 2017 |
| C | 2,279 | 2,158 | 1,903 |
| D | 23,616 | 22,106 | 19,824 |
| Total | 25,895 | 24,264 | 21,727 |
FEC (licensed) machine numbers (average)
| Machine category | Apr 2014-Mar 2015 | Apr 2015-Mar 2016 | Apr 2016-Mar 2017 |
| C | 4.14 | 3.56 | 3.03 |
| D | 59.42 | 61.68 | 59.93 |
| Aggregated categories37 | 6.26 | 5.54 | 1.55 |
| Total | 69.83 | 70.78 | 64.52 |
FEC (licensed) GGY (£m)
Remote Gambling
As of 31 March 2017, there were 788 remote gambling licensed activities, an increase of 4.6%. Gambling software and remote licensed casinos accounted for the majority of 56.1%.
| Licensed activity | As at 31 Mar 2015 | As at 31 Mar 2016 | As at 31 Mar 2017 |
| Betting Intermediary | 18 | 16 | 17 |
| Betting Intermediary – Trading Rooms Only | 7 | 7 | 5 |
| Bingo | 50 | 58 | 54 |
| Casino | 179 | 184 | 187 |
| Gambling Software15 | 217 | 241 | 255 |
| General Betting Limited (telephone only) | 24 | 23 | 22 |
| General Betting Standard – Real Event | 102 | 94 | 105 |
| General Betting Standard – Virtual Event | 39 | 43 | 49 |
| Pool Betting | 70 | 87 | 94 |
| Totals | 706 | 753 | 788 |
Remote gambling activities licensed by the Commission
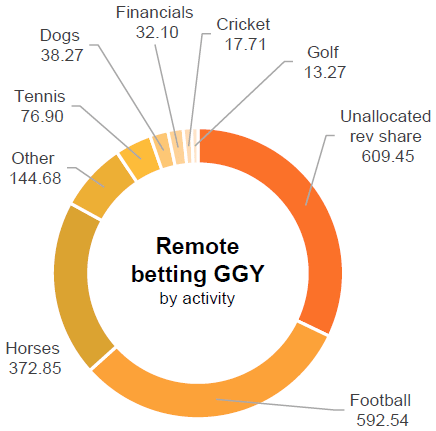
Remote sector GGY totaled £4.68bn from April 2016 to March 2017 excluding remote national lottery and large sector lotteries. This was further split into £2.22bn of proprietary GGY (47.4%) and £2.47bn revenue share GGY(52.6%).
| Proprietary GGY | Revenue share GGY | Total GGY | |
| Betting | 1,126.68 | 609.45 | 1,736.13 |
| Betting Exchange | 129.32 | – | 129.32 |
| Bingo | 57.39 | 104.96 | 162.36 |
| Casino | 871.45 | 1,748.67 | 2,620.13 |
| Pool Betting | 32.32 | – | 32.32 |
| Totals | 2,217.17 | 2,463.09 | 4,680.25 |
GGY from remote gambling activities for GB customers only (£m)
This total was mostly made up of remote casino (56.0%) and remote betting (37.1%), which collectively accounted for 93.1% of remote GGY.
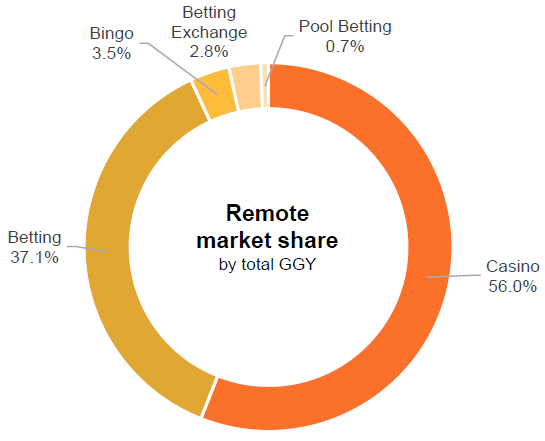
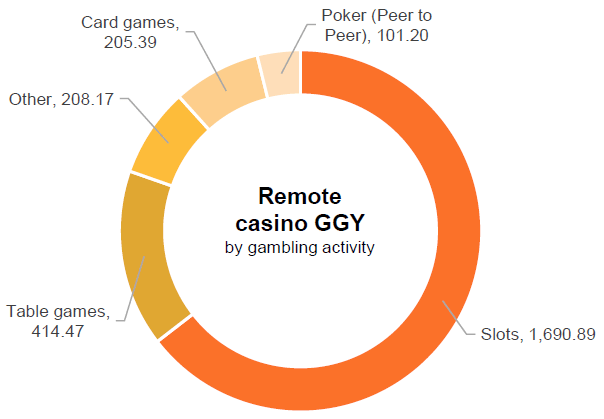
In terms of remote casino GGY, slots accounted for £1.69bn (64.5%) and table games accounted for £414m (15.8%).
Finally, remote betting GGY was mostly dominated by football (31.2%) and horses (19.6%).
Gambling Statistics Report: 2013-2016
Gambling Industry Data
Much like the 2010-2015 gambling report, the Gambling (Licensing and Advertising) Act came into effect on November 1st. Since all the post-November 1st data accounts for remote betting that affects GB or its citizens while the data before does not, these two data sets cannot be directly compared.
Betting
The number of off-course betting premises was 8,709 as of 30 September 2016, which is a decrease of 1.8% from the previous period. The majority of ownership was centered around 4 operators holding 87.7% of the market.
| Organisation | As at 31 Mar 2015 | As at 31 Mar 2016 | As at 30 Sep 2016 | % of total betting shops |
| William Hill | 2,308 | 2,326 | 2,329 | 26.7% |
| Ladbrokes | 2,190 | 2,149 | 2,145 | 24.6% |
| Gala Coral | 1,838 | 1,835 | 1,805 | 20.7% |
| Betfred | 1,375 | 1,366 | 1,359 | 15.6% |
| Other operators | 1,272 | 1,191 | 1,071 | 12.3% |
| Total | 8,983 | 8,867 | 8,709 | 100% |
Number of betting shops by operator
Over-the-counter betting accounted for 44.8% of off-course betting during April 2015 and March 2016, with the other 55.2% represented by machines on betting premises.
In terms of on-course betting, horses dominated the GGY, although there was an overall decrease in both horses and betting, while there was an increase in ‘other’ betting.
Similarly, pool betting was also dominated by horses and saw an 11% decrease in GGY compared to the preceding period.
Bingo
As of 30 September 2016 there were 575 bingo premises operated by 199 companies, which is a 4.4% decrease from the previous period. The two biggest in the industry are Gala Leisure Limited and Mecca Bingo Limited, which accounted for 37.7% of premises.
In terms of total GGY, we saw £687.04m from April 2015 to March 2016, with mechanized bingo providing the largest percentage (65.4%), followed by mainstage (33.4%) and prize (1.2%).
Finally, Bingo games represented £376.64m (54.8%) of the total GGY, with machines representing the other £310.40m (45.2%).
Casino
As of 31 March 2016 there were 148 casinos dominated by two operators holding 71% of premises.
| Organisation | As at 31 Mar 2014 | As at 31 Mar 2015 | As at 31 Mar 2016 |
| Rank Group | 63 | 63 | 63 |
| Genting UK | 41 | 41 | 41 |
| Caesars Entertainment | 9 | 9 | 9 |
| 2005 Act Casinos | 2 | 2 | 4 |
| Other operators | 32 | 33 | 31 |
| Total | 147 | 148 | 148 |
Number of operating casinos (2005 and 1968 Act casinos)
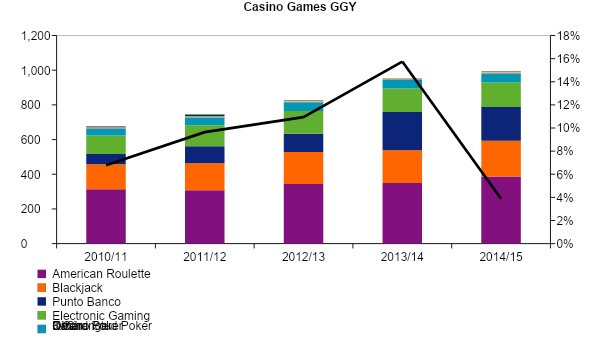
Casino games GGY was dominated by American roulette (43.4%), followed by blackjack (25.4%), and electronic gaming (19.7%).
| Organisation | Apr 2013-Mar 2014 | Apr 2014-Mar 2015 | Apr 2015-Mar 2016 |
| 3 Card Poker | 230 | 235 | 240 |
| American Roulette | 872 | 840 | 856 |
| Blackjack | 603 | 591 | 603 |
| Casino Stud Poker | 6 | 12 | 7 |
| Dice | 16 | 12 | 13 |
| Other | 62 | 81 | 67 |
| Punto Banco | 162 | 156 | 157 |
| Total | 1,952 | 1,927 | 1,943 |
Industry table numbers (average)
Gaming machines saw an increase of 7%, which accounted for a 1.8% increase in the total number of machines.
Casino game GGY was £195.39m, which constituted a 16% increase from the previous period. Casino games account for a large £802.69m (80.4%) of total GGY, with gaming machines making up the rest, £195.39m (19.6%).
Arcades
As of 30 September 2016, there were 483 AGCs and 158 FECs held together by 522 operators, although the number has declined steadily over the reporting period.
| Commission licensed activity | As at 31 Mar 2014 | As at 31 Mar 2015 | As at 31 Mar 2016 |
| Adult gaming centre (AGC) | 1,598 | 1,455 | 1,337 |
| Family entertainment centre (FEC)35 | 331 | 293 | 258 |
Number of arcade premises
In terms of ACGs, machine numbers totaled 48,183, which was a 3.1% decrease from the last period. That being said, there was an overall GGY increase of £319.16m (2.3%).
| Machine category | Apr 2013-Mar 2014 | Apr 2014-Mar 2015 | Apr 2015-Mar 2016 |
| B3 | 9,666 | 9,423 | 9,532 |
| B4 | 62 | 87 | 54 |
| C | 28,133 | 26,683 | 26,715 |
| D | 15,564 | 13,514 | 11,882 |
| Total | 53,425 | 49,706 | 48,183 |
AGC machine numbers (average)
| Machine category | Apr 2013-Mar 2014 | Apr 2014-Mar 2015 | Apr 2015-Mar 2016 |
| B3 | 144.55 | 154.21 | 165.10 |
| B4 | 0.19 | 0.20 | 0.18 |
| C | 105.42 | 108,33 | 112.94 |
| D | 26.08 | 24.34 | 22.87 |
| Aggregated categories36 | 35.59 | 24.82 | 18.08 |
| Total | 311.83 | 311.90 | 319.16 |
AGC machine GGY (£m)
On the other hand, FECs saw a £63.51m (6.5%) GGY decrease. The average total quantity for FEC machines was 20,562, which constitutes a 15.1% decrease from the previous reporting period.
| Machine category | Apr 2013-Mar 2014 | Apr 2014-Mar 2015 | Apr 2015-Mar 2016 |
| C | 2,002 | 2,140 | 1,788 |
| D | 27,115 | 22,175 | 18,864 |
| Total | 29,117 | 24,315 | 20,652 |
FEC (licensed) machine numbers (average)
| Machine category | Apr 2013-Mar 2014 | Apr 2014-Mar 2015 | Apr 2015-Mar 2016 |
| C | 3.44 | 3.90 | 3.11 |
| D | 56.31 | 57.95 | 55.70 |
| Aggregated categories37 | 7.57 | 6.08 | 4.69 |
| Total | 67.32 | 67.93 | 63.51 |
FEC (licensed) GGY (£m)
Remote Gambling
Remote sector gambling account for £4,47bn of revenue during April 2015 to March
2016 (although that excludes National Lottery and large sector lottery numbers).
| Proprietary GGY | Revenue Share GGY | Total GGY | |
| Betting | 1,053.19 | 513.63 | 1,566.83 |
| Betting Exchange | 151.86 | – | 151.86 |
| Bingo | 52.05 | 100.62 | 152.66 |
| Casino | 1,009.82 | 1,561.60 | 2,571.42 |
| Pool Betting | 25.86 | – | 25.86 |
| Total | 2,292.79 | 2,175.85 | 4,468.64 |
GGY from remote gambling activities (£m) for GB customers only
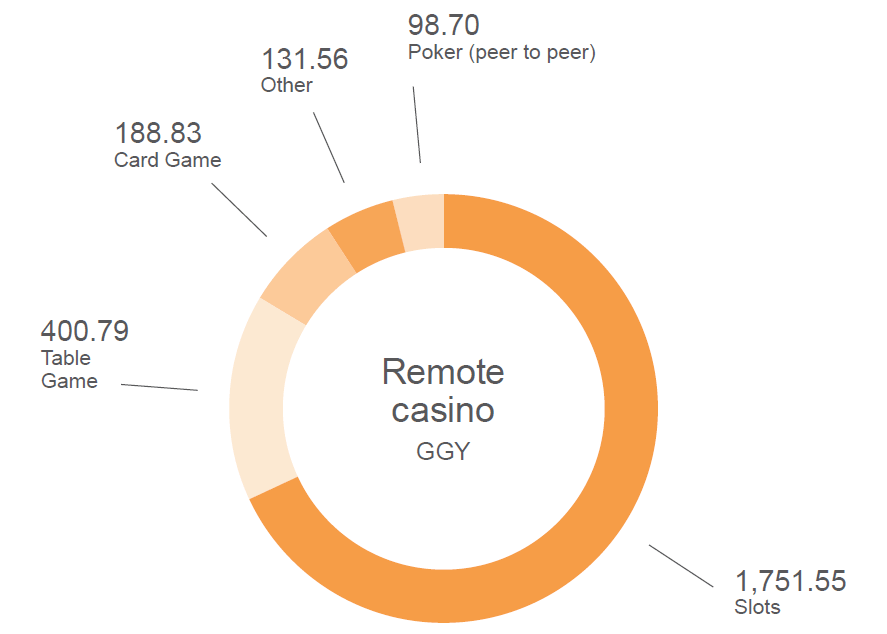
Remote casinos had the largest share in GGY of 57.5%, while remote betting had 35.1%, both accounting for 92.6% of overall remote GGY.
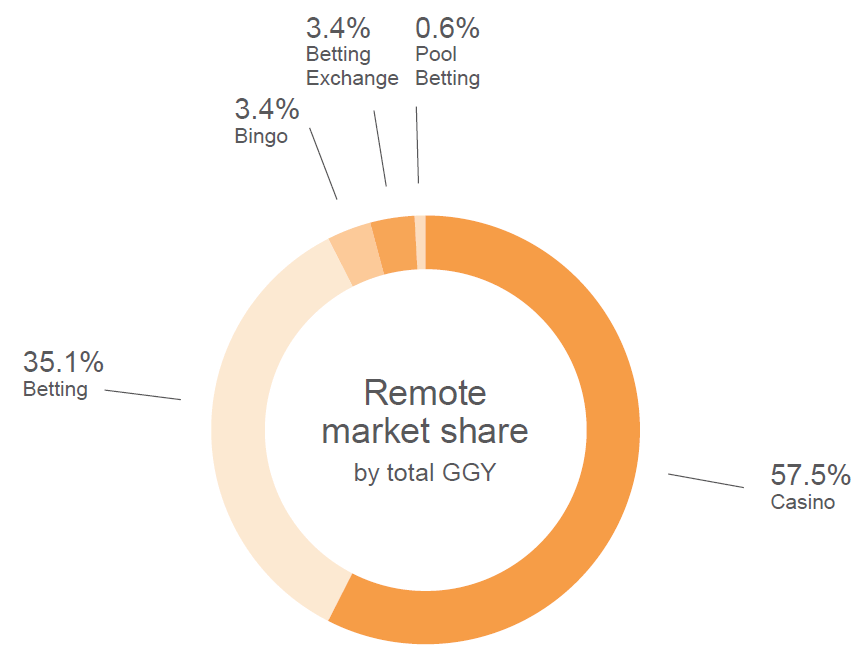
For remote casino GGY specifically, slots accounted for the largest share of £1,751.55m (68.1%), followed by table games £400.79m (15.6%), and card games £188.83m (7.3%).
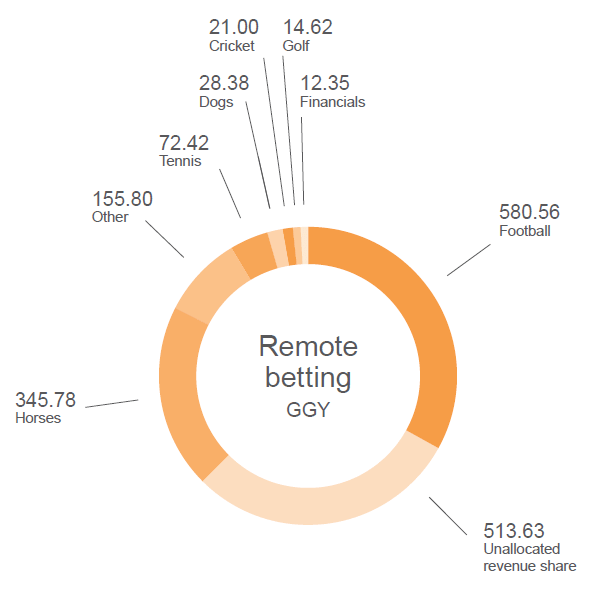
As for remote betting, football had the lion’s share at 37% of total GGY. This was followed by horses (22%) and ‘other’ (9.9%), with unallocated revenue making up another 32.8%.
Gambling Statistics Report: 2010-2015
Gambling Industry Data
Much like other reports in this article, the data past March 2013 has a different source and is therefore considered a new point in a set of data for information. Where this report differs though, is that on November 1st, 2014 the Gambling (Licensing and Advertising) Act came into effect. Ostensibly this act aims to regulate foreign businesses that do business in Britain or with British nationals.
Therefore, remote gambling numbers are broken up into pre-November 2014 numbers and post-November 2014 numbers, and should not be directly compared as they do not account for the same sources.
Betting
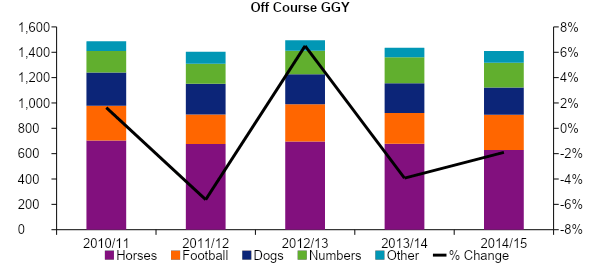
Off-course betting GGY saw a general decline of approximately 3% over the reporting period, with a slight bump in football betting in 2012-2013 due to the 2012 world cup.
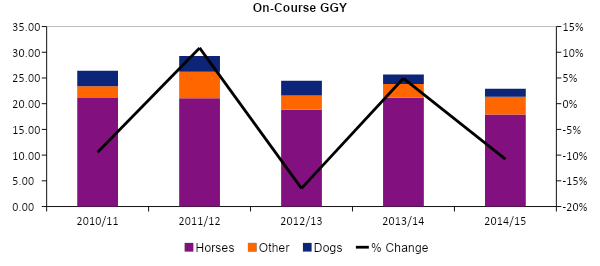
On-course betting GGY also saw a decrease, although much smaller than off-course, with horses accounting for the largest proportion of betting.
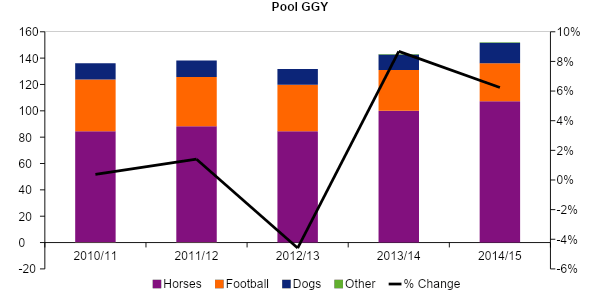
Pool betting on the other hand saw a large increase of approximately 6% from April 2010 to March 2015.
Bingo
As of 30 September 2015, there were 201 operators with non-remote bingo licenses, as the table below shows. Keep in mind that the figures shown in the table starting 2013 and onward regulatory returns from operators themselves.
| Commission licensed activity | at 31 Mar 2011 | at 31 Mar 2012 | at 31 Mar 2013 | at 31 Mar 2014 | at 31 Mar 2015 |
| Gala Leisure Limited | 267 | 143 | 137 | 135 | 135 |
| Mecca Bingo Limited | 103 | 97 | 98 | 97 | 91 |
| Other operators | 325 | 406 | 476 | 441 | 389 |
| Total | 695 | 646 | 711 | 673 | 615 |
Number of premises by operator
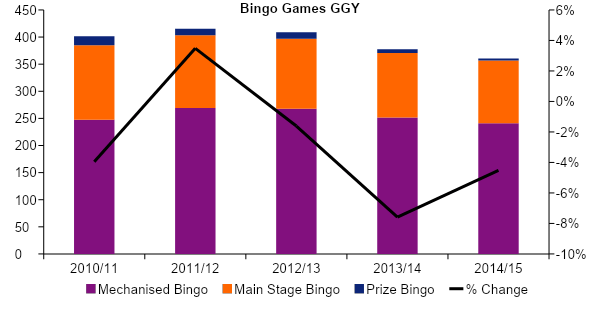
In terms of Bingo GGY, the overall figures have stayed roughly the same by March 2015, with a 3.5% rise in 2011/2012 and then a dip of 4% in 2013/2014.
On the other hand, gaming machine GGY saw an overall increase of £77.51m over the reporting period. It should be noted that the increase in categories B3 and C was mostly due to operators instituting better systems for tracking GGY by category of machine.
| Machine category | Apr 2010-Mar 2011 | Apr 2011-Mar 2012 | Apr 2012-Mar 2013 | Apr 2013-Mar 2014 | Apr 2014-Mar 2015 |
| B3 | 58.08 | 76.32 | 136.54 | 156.19 | 158.94 |
| B4 | 1.73 | 1.35 | 1.13 | 0.75 | 0.62 |
| C | 71.61 | 81.00 | 129.01 | 110.84 | 107.69 |
| D | 5.02 | 8.10 | 20.60 | 19.70 | 17.24 |
| Aggregated categories | 87.74 | 98.47 | 5.23 | 7.27 | 17.19 |
| Total | 224.18 | 265.26 | 292.50 | 294.75 | 301.69 |
Gaming machine GGY (£m)

Casino
Of the 148 Casinos operational by 31 March 201, 104 were operated by two companies: Rank Group and Genting UK.
| Organisation | at 31 Mar 2011 | at 31 Mar 2012 | at 31 Mar 2013 | at 31 Mar 2014 | at 31 Mar 2015 |
| Rank Group (Grosvenor and
‘G’ Casinos) |
37 | 36 | 38 | 63 | 63 |
| Genting UK (Genting Casinos) | 46 | 44 | 42 | 41 | 41 |
| Gala Coral Group (Gala Casinos) | 28 | 27 | 25 | 0 | 0 |
| London Clubs International | 11 | 10 | 11 | 9 | 9 |
| Other operators | 27 | 28 | 27 | 32 | 33 |
| 2005 Act Casinos | – | 1 | 1 | 2 | 2 |
| Total | 149 | 146 | 144 | 147 | 148 |
Number of operating casinos
Casino win GGY saw a steady increase until 2014, after which there was a steep decline to 4%, roughly half of where it was from the start of the reporting period.
As for casino gaming machines, the GGY rose year-after-year by 42% and accounted for 7% of gaming machine GGY.
| Machine category | Apr 2010-Mar 2011 | Apr 2011-Mar 2012 | Apr 2012-Mar 2013 | Apr 2013-Mar 2014 | April 2014-Mar 2015 |
| B1 | 117.67 | 126.27 | 130.11 | 145.88 | 156.90 |
| B2 | 1.26 | 2.50 | 5.71 | 9.56 | 11.72 |
| B3 | 0.07 | 0.17 | 0.35 | 0.45 | 0.18 |
| Aggregated categories | 0.00 | 0.00 | 0.00 | 0.00 | 0.00 |
| Total | 119.00 | 128.95 | 136.18 | 155.89 | 168.80 |
Gaming machine GGY (£m)

Arcades
Over the 5 year reporting period, the number of AGC machines has declined by 16% and accounted for roughly 29.4% of the average number of regulated machines. Conversely, AGC GGY has increased slightly in all categories of machines.
| Machine category | Apr 2010-Mar 2011 | Apr 2011-Mar 2012 | Apr 2012-Mar 2013 | Apr 2013-Mar 2014 | Apr 2014-Mar 2015 |
| B3 | 8,698 | 8,695 | 9,103 | 9,659 | 9,386 |
| B4 | 198 | 61 | 43 | 62 | 101 |
| C | 30,989 | 27,390 | 25,999 | 28,013 | 26,214 |
| D | 18,611 | 18,454 | 17,622 | 15,338 | 13,330 |
| Total | 58,496 | 54,600 | 52,768 | 53,072 | 49,031 |
Average AGC machine numbers
| Machine category | Apr 2010-Mar 2011 | Apr 2011-Mar 2012 | Apr 2012-Mar 2013 | Apr 2013-Mar 2014 | Apr 2014-Mar 2015 |
| B3 | 100.27 | 113.85 | 122.92 | 142.34 | 145.40 |
| B4 | 0.47 | 0.32 | 0.29 | 0.19 | 0.23 |
| C | 86.02 | 86.02 | 95.28 | 103.48 | 101.95 |
| D | 24.77 | 20.76 | 26.66 | 24.73 | 22.46 |
| Aggregated categories | 104.34 | 81.45 | 43.54 | 39.55 | 33.60 |
| Total | 315.88 | 302.40 | 288.70 | 310.28 | 303.63 |
AGC machine GGY (£m)
Similarly, the average number of licensed FEC machines decreased overall, especially in the Apr 2014 – Mar 2015 period. As such, it’s no surprise that FEC GGY also decreased by £8m in the reporting period.
| Machine category | Apr 2010-Mar 2011 | Apr 2011-Mar 2012 | Apr 2012-Mar 2013 | Apr 2013-Mar 2014 | Apr 2014-Mar 2015 |
| C | 3,275 | 2,469 | 2,497 | 2,098 | 2,321 |
| D | 26,214 | 28,764 | 28,465 | 27,162 | 22,794 |
| Total | 29,489 | 31,233 | 30,962 | 29,260 | 25,115 |
Average licensed FEC machine numbers
| Machine category | Apr 2010-Mar 2011 | Apr 2011-Mar 2012 | Apr 2012-Mar 2013 | Apr 2013-Mar 2014 | Apr 2014-Mar 2015 |
| C | 6.38 | 5.80 | 4.56 | 3.40 | 3.51 |
| D | 61.12 | 66.31 | 55.70 | 56.06 | 57.26 |
| Aggregated categories | 8.62 | 6.55 | 8.95 | 7.71 | 7.25 |
| Total | 76.12 | 78.66 | 69.21 | 67.18 | 68.03 |
Licensed FEC GGY (£m)
Remote Gambling
As mentioned earlier, remote gambling has a different set of numbers that were collected differently post November 2014. To that end, figures were collated for both periods and presented separately.
| Regulated under the Gambling Act 2005 | Regulated under Gambling (Licensing and Advertising) Act 2014. | |||||
| Remote activity | at 31 March 2012 | at 31 March 2013 | at 31 March 2014 | at 31 March 2015 | at 30 Sept 2015 | |
| Gambling Software | 93 | 97 | 90 | 212 | 233 | |
| Casino | 23 | 26 | 27 | 178 | 176 | |
| General Betting Standard – Real Event | 56 | 50 | 43 | 103 | 95 | |
| Pool Betting | 47 | 45 | 46 | 71 | 79 | |
| Bingo | 10 | 10 | 9 | 49 | 52 | |
| General Betting Standard – Virtual Event | 15 | 16 | 12 | 38 | 37 | |
| General Betting Limited (Telephone only) | 37 | 29 | 22 | 24 | 24 | |
| Betting Intermediary | 10 | 10 | 10 | 19 | 17 | |
| Betting Intermediary – Trading Rooms Only | 14 | 12 | 10 | 7 | 6 | |
| Grand Total | 305 | 295 | 269 | 701 | 719 | |
Breakdown of remote gambling activities licensed by the Commission
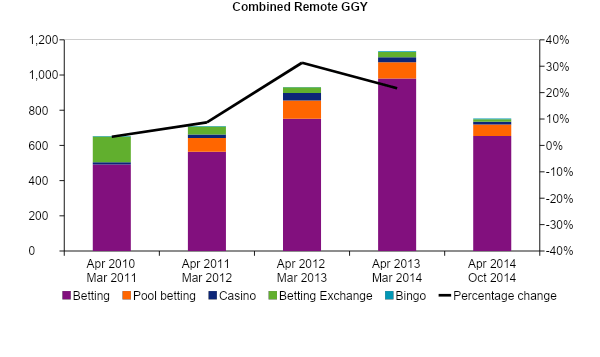
Pre-November 2014 combined remote gambling GGY saw an overall increase of roughly 20%, with a spike of over 30% in the April 2012 to March 2013 period, with betting dominating the majority of the industry.
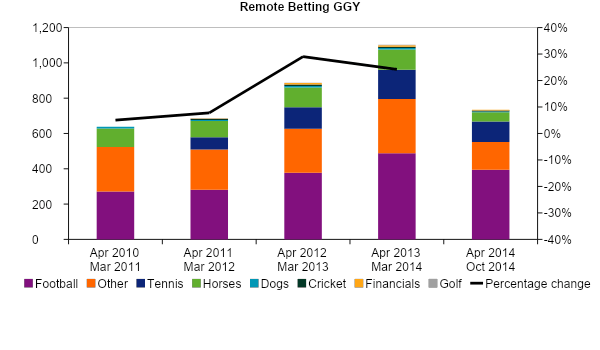
Pre-November 2014 remote betting saw a large rise to over 20%, with football and other accounting for large portions of remote betting GGY.
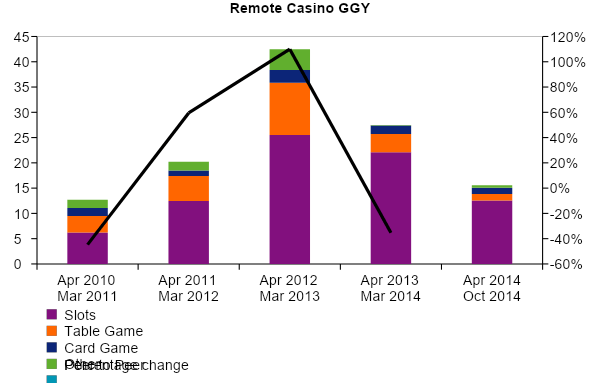
As for pre-November remote casino GGY, we saw a large increase of nearly 120% in the April 2012 – March 2013 period, before crashing down to nearly the same level as April 2010.
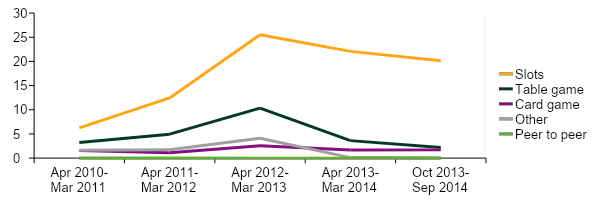
In terms of post-November 2014 figures, since there’s no previous year with similarly used methodology, we cannot compare to previous figures. Even so, the numbers are great indicators of what areas of remote gambling are doing better. For example, football and horses dominated the remote gambling sector, and slots dominating the remote casino sector.
| November 2014 to 31 March 2015 | |||
| GGY | Proprietary GGY | Revenue Share GGY | Total GGY |
| Cricket | 4.79 | – | 4.79 |
| Dogs | 9.26 | – | 9.26 |
| Financials | 3.10 | – | 3.10 |
| Football | 168.44 | – | 168.44 |
| Golf | 3.63 | – | 3.63 |
| Horses | 127.86 | – | 127.86 |
| Tennis | 25.31 | – | 25.31 |
| Other | 37.35 | – | 37.35 |
| Revenue share | – | 154.91 | 154.91 |
| Total | 379.74 | 154.91 | 534.65 |
GGY from remote betting gambling activities (£m) for GB customers only.
| November 2014 to 31 March 2015 | |||
| Proprietary GGY | Revenue Share GGY | Total GGY | |
| Card games | 20.52 | 47.18 | 67.70 |
| Peer to Peer | 30.50 | 6.17 | 36.67 |
| Slots | 253.93 | 278.60 | 532.54 |
| Table games | 46.45 | 93.88 | 140.34 |
| Other | 8.47 | 48.53 | 57.01 |
| Total | 359.88 | 474.37 | 834.25 |
GGY from remote casino gambling activities (£m) for GB customers only.
Gambling Statistics Report: 2010-2014
Gambling Industry Data
As mentioned previously, since returns dates are decided by the operators, certain figures provided in this report are estimates provided by the Gambling Commission. Specifically, the period between 1 October 2013 to 30 September 2014 will be the period with the most estimated figures.
Also important to note is that the reporting methodology was changed past 31 March 2013, with the new figures being based on operators’ most recent regulatory return. This means that new data past those dates are not comparable to the ones before it.
Betting
The industry for non-remote betting is composed of both on-course and off-course betting, and as of 31 March 2015, there are 299 operators, although the majority of the industry is dominated by four operators who account for 86% of the industry (as shown below). This number of operators was a decrease of 51 from the same period in the previous year.
| Organisation | at 31 Mar 2011 | at 31 Mar 2012 | at 31 Mar 2013 | at 31 Mar 2014 | at 31 Mar 2015 | |
| William Hill | 2,350 | 2,320 | 2,345 | 2,382 | 2,309 | |
| Ladbrokes | 2,097 | 2,131 | 2,227 | 2,271 | 2,205 | |
| Gala Coral Group | 1,712 | 1,725 | 1,745 | 1,812 | 1,838 | |
| Betfred | 840 | 1,345 | 1,369 | 1,383 | 1,381 | |
| Tote | 514 | |||||
| Other operators | 1,554 | 1,607 | 1,414 | 1,289 | 1,225 | |
| Total | 9,067 | 9,128 | 9,100 | 9,137 | 8,958 |
When it comes to off-course betting, horses and dogs have declined by £424m (8%) and £131m (10%) respectively, while football saw an increase of £287m (28%).


GGY for off-course also followed a similar trend, with horses and dogs declining but football seeing an increase.


On-course betting also saw a decline, although a much shallower one, with an overall decline of £76m (23%) in the reporting period.


Interestingly, while GGY saw a decrease overall, other betting saw an increase of £0.63m (28%)


Finally, the turnover for pool betting saw an increase of £73m (15%) overall, with a substantial increase for horses of £80m (20%), although dogs did see a decline.


Similarly, GGY saw an overall increase of £17m (13%), with horses increasing by £26m (30%) but a decrease of football of £10m (24%).


Bingo
As of 31 March 2015 there were 209 bingo operators with a non-remote license.
Bingo turnover saw a general decline of £159m (12%) in the reporting period, with a main stage decline of £83m (12%), mechanized decline of £54m (10%), and prize decline of £22m (68%).


Similarly, overall GGY saw a decline of £39m (10%) with main stage decline of £20m (15%), mechanised decline of £7m (3%), and prize declined £12m (71%).


Finally, with the introduction of electronic bingo terminals, the makeup of the machines has changed dramatically in the reporting period, with the majority of machines operating at category C.
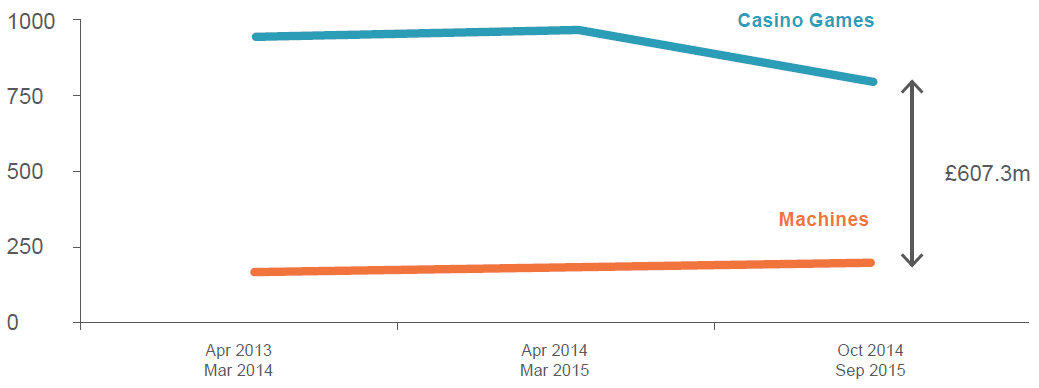
| Machine category | Apr 2010-Mar 2011 | Apr 2011-Mar 2012 | Apr 2012-Mar 2013 | Apr 2013-Mar 2014 | Oct 2013-Sep 2014 |
| B3 | 3,788 | 4,643 | 6,446 | 7,498 | 7,767 |
| B4 | 240 | 195 | 183 | 148 | 131 |
| C | 14,840 | 16,413 | 21,183 | 31,527 | 40,190 |
| D | 5,022 | 17,804 | 19,411 | 11,217 | 4,418 |
| Total | 23,890 | 39,054 | 47,223 | 50,390 | 52,506 |
In terms of GGY, bingo saw a decline of 10% from £401m to £362m while gaming machines saw an increase of 33% from £224m to £297m.

Casino
Overall industry numbers have decreased by 0.5% in the reporting period, with casino stud poker suffering a decrease year-on-year to the point where it no longer features in many casinos.


In terms of drop and win, overall casino drop has increased by £2.26bn (46%) since the April 2010–March 2011 period, with punto banco drop increased by a massive £1.49bn (240%). Wins also saw an increase of £309.6m in the period, with punto banco wins increasing by £161.5m (273%).


Finally, gaming machine numbers have increased across the board by 11%, with category B machines being in the majority.
| Machine category | Apr 2010-Mar 2011 | Apr 2011-Mar 2012 | Apr 2012-Mar 2013 | Apr 2013-Mar 2014 | Oct 2013-Sep 2014 |
| B1 | 2,603 | 2,788 | 2,675 | 2,676 | 2,729 |
| B2 | 30 | 56 | 111 | 175 | 185 |
| B3 | 4 | 11 | 9 | 14 | 11 |
| Total | 2,637 | 2,855 | 2,795 | 2,866 | 2,925 |
Average gaming machine numbers
Arcades
ACG gaming machine numbers have declined year on year within the reporting period, with a drop from 39.59% in April 2010-March 2011 to 30.11% in October 2013–September 2014. As for the GGY of ACG machines, we’ve seen a decrease from 15% to 12% across all sectors.
| Machine category | Apr 2010-Mar 2011 | Apr 2011-Mar 2012 | Apr 2012-Mar 2013 | Apr 2013-Mar 2014 | Oct 2013-Sep 2014 |
| B3 | 8,698 | 8,695 | 9,084 | 9,561 | 9,379 |
| B4 | 198 | 61 | 43 | 62 | 91 |
| C | 30,989 | 27,390 | 25,938 | 27,819 | 27,129 |
| D | 18,611 | 18,454 | 17,508 | 14,978 | 13,930 |
| Total | 58,496 | 54,600 | 52,573 | 52,419 | 50,530 |
Average AGC machine numbers
| Machine category | Apr 2010-Mar 2011 | Apr 2011-Mar 2012 | Apr 2012-Mar 2013 | Apr 2013-Mar 2014 | Oct 2013-Sep 2014 |
| B3 | 100.27 | 113.78 | 122.05 | 138.46 | 140.61 |
| B4 | 0.47 | 0.32 | 0.29 | 0.19 | 0.23 |
| C | 86.02 | 86.02 | 94.60 | 100.19 | 100.13 |
| D | 24.77 | 20.76 | 26.38 | 23.29 | 21.93 |
| Aggregated categories | 104.34 | 81.45 | 44.72 | 45.93 | 43.20 |
| Total | 315.88 | 302.40 | 288.05 | 308.07 | 306.09 |
AGC machine GGY (£m)
FECs also saw a decrease from 19.96% in April 2010-March 2011 to 15.8% in October 2013–September 2014. Much like ACGs, the GGY of FEC decreased as well, from 4% in April 2010-March 2011 to 3% across all sectors.
| Machine category | Apr 2010-Mar 2011 | Apr 2011-Mar 2012 | Apr 2012-Mar 2013 | Apr 2013-Mar 2014 | Oct 2013-Sep 2014 |
| C | 3,275 | 2,469 | 2,458 | 2,059 | 2,031 |
| D | 26,214 | 28,764 | 28,379 | 27,118 | 24,484 |
| Total | 29,489 | 31,233 | 30,837 | 29,177 | 26,515 |
Average licensed FEC machine numbers
| Machine category | Apr 2010-Mar 2011 | Apr 2011-Mar 2012 | Apr 2012-Mar 2013 | Apr 2013-Mar 2014 | Oct 2013-Sep 2014 |
| C | 6.38 | 5.80 | 4.56 | 3.40 | 3.34 |
| D | 61.12 | 66.31 | 53.00 | 53.20 | 56.97 |
| Aggregated categories19 | 8.62 | 6.55 | 11.31 | 10.14 | 6.73 |
| Total | 76.12 | 78.66 | 68.87 | 66.73 | 67.04 |
Licensed FEC GGY
Remote Gambling
Remote betting dominated the remote gambling sector during this reporting period, accounting for £31.5bn of the £32.5bn turnover in October 2013-September 2014, with an increase of almost £6.2bn (23%) in the April 2013-March 2014 period.
As for GGY, the overall numbers have increased year after year since April 2010-March 2011. There was a large decrease in GGY during April 2011-March 2012, which was mostly due to Betfair moving its regulated activity off-shore.


During the October 2013-September 2014, remote betting was mostly dominated by football, ‘other’ (which refers to other types of gambling), and tennis.


Finally, turnover and GGY for remote casino has decreased by £4.3m (1%) and £3.4m (12%) respectively.


Gambling Statistics Report: 2009-2014
Gambling Industry Data
Returns in the gambling industry are done yearly (or sometimes quarterly depending on the sector), and the dates set for said returns are picked by the operators. That means that for the last year of the report (1 April 2013 to 31 March 2014), some figures are estimates made by the gambling commission. Said adjustments are weighted based on the time of the report given, and since the gambling commission must report on all returns, these adjustments are normal.
That being said, it’s important to be aware that the period between 1 April 2013 to 31 March 2014 has some estimated figures.
Betting
As of the 30th of September 2014, 86% of all betting shops were largely operated by four main companies: William Hill, Ladbrokes, Gala Coral Group, and Betfred. Another 1,200-1,600 betting shops were operated by other companies, although that number decreased from the higher end to the lower end as the years progressed.
| Organisation | at 31 Mar 2011 | at 31 Mar 2012 | at 31 Mar 2013 | at 31 Mar 2014 | at 30 Sept 2014 | |
| William Hill | 2,350 | 2,320 | 2,345 | 2,382 | 2,394 | |
| Ladbrokes | 2,097 | 2,131 | 2,227 | 2,271 | 2,266 | |
| Gala Coral Group | 1,712 | 1,725 | 1,745 | 1,812 | 1,836 | |
| Betfred | 840 | 1,345 | 1,369 | 1,383 | 1,381 | |
| Tote | 514 | |||||
| Other operators | 1,554 | 1,607 | 1,390 | 1,268 | 1,231 | |
| Total | 9,067 | 9,128 | 9,076 | 9,116 | 9,108 |
In terms of off-course betting, we saw a general decline over the reporting years for both horses and dogs (£569m and £134m respectively), while Football and numbers managed steady increases.


On-course betting also saw a general decline of 22% in the reporting period. More specifically, dog and horse profits declined by 50% and 15%, although other betting has seen a small increase of £0.86m (48%).


On the other hand, pool betting has seen a general increase of 13% in the reporting period, mostly made up of an increase in horse betting by 23%, which saw dogs, horses, and other betting decline slightly.
Bingo
As of 30 September 2014, there were 212 operators which held non-remote bingo licenses, with the table below showing two of the larger operators:
| Organisation | at 31 Mar 2011 | at 31 Mar 2012 | at 31 Mar 2013 | at 31 Mar 2014 | at 30 Sept 2014 | |
| Gala Leisure Limited | 267 | 143 | 140 | 137 | 137 | |
| Mecca Bingo Limited | 103 | 97 | 97 | 98 | 97 | |
| Other operators | 325 | 406 | 441 | 435 | 419 | |
| Total | 695 | 646 | 678 | 670 | 653 |
Overall, bingo turnover figures have decreased by 14% in the reporting period, with main stage bingo seeing a decline of £104m (15%), mechanized bingo a decline of £49m (9%), and prize bingo a decline of £37.3m (71%).


As for GGY for bingo, we also see an 8% decrease in the reporting period: mechanized bingo saw an increase of £19.29m, while main stage saw a decline of £30m, and prize bingo a decline of £21m.


Casino
Overall Casino attendance grew in the reporting period, with the biggest gain being inside London, going from 3.58 million to 6.47 million by March 2014.
| Apr 2009-Mar 2010 m | Apr 2010-Mar 2011 m | Apr 2011-Mar 2012 m | Apr 2012-Mar 2013 m | Apr 2013-Mar 2014 m | |
| Scotland | 1.70 | 1.84 | 1.88 | 1.72 | 1.65 |
| North | 4.85 | 4.87 | 5.06 | 5.46 | 5.44 |
| Midlands & Wales | 3.93 | 4.01 | 4.14 | 4.03 | 3.69 |
| South | 2.90 | 2.96 | 3.04 | 3.03 | 3.41 |
| London high end | 0.15 | 0.16 | 0.16 | 0.14 | 0.16 |
| Other London | 3.58 | 3.55 | 3.96 | 5.50 | 6.47 |
| Total | 17.11 | 17.39 | 18.24 | 19.88 | 20.82 |
Casino attendance by region
Generally speaking, industry table numbers have suffered a decline of 1% over the reporting period, with casino stud poker taking the biggest hit.


Finally, overall casino drop has increased by £2.5bn (58%) with a little over half of this increase recorded by punto banco. Similarly, overall casino win has increased by £316m, with growth in all casino games except dice and ‘other’.
Arcades
In the reporting period, there was an overall decrease in both ACGs and FEC, with ACGs accounting for 30.46% of all gaming machines, and FEC accounting for 17.96%.
| Machine category | Apr 2009-Mar 2010 | Apr 2010-Mar 2011 | Apr 2011-Mar 2012 | Apr 2012-Mar 2013 | Apr 2013-Mar 2014 |
| B3 | 9,399 | 8,698 | 8,673 | 8,918 | 9,206 |
| B4 | 170 | 198 | 61 | 41 | 46 |
| C | 35,994 | 30,989 | 27,282 | 25,394 | 26,741 |
| D | 18,913 | 18,611 | 18,383 | 17,125 | 14,399 |
| Total | 64,476 | 58,496 | 54,398 | 51,479 | 50,392 |
Average AGC machine numbers
| Machine category | Apr 2009-Mar 2010 £m | Apr 2010-Mar 2011 £m | Apr 2011-Mar 2012 £m | Apr 2012-Mar 2013 £m | Apr 2013-Mar 2014 £m |
| C | 5.62 | 6.38 | 5.78 | 4.36 | 3.21 |
| D | 57.49 | 61.12 | 66.11 | 55.41 | 63.18 |
| Aggregated categories19 | 14.61 | 8.62 | 6.51 | 11.05 | 13.69 |
| Total | 77.72 | 76.12 | 78.40 | 70.82 | 80.08 |
Average licensed FEC machine numbers
Remote Gambling
Overall UK remote gambling GGY has seen an increase of £684m in the reporting period and accounts for roughly 6% of global remote GGY.
| Jan 2009-Dec 2009 £m | Jan 2010-Dec 2010 £m | Jan 2011-Dec 2011 £m | Jan 2012-Dec 2012 £m | Jan 2013-Dec 2013 £m | |
| GGY | 1,760 | 1,940 | 2,040 | 2,064 | 2,444 |
The UK consumer remote industry
When it comes to turnover, the sector is dominated by betting which accounts for £25.6bn of the £26.4bn, turnover in the period between April 2013-March 2014.
GGY figures have also increased year-on-year from the start of the reporting period, with betting again dominating and accounting for £980m of £1.1bn in the period of April 2013-March 2014.